

Perhaps the Most Important Chart in the Investing World
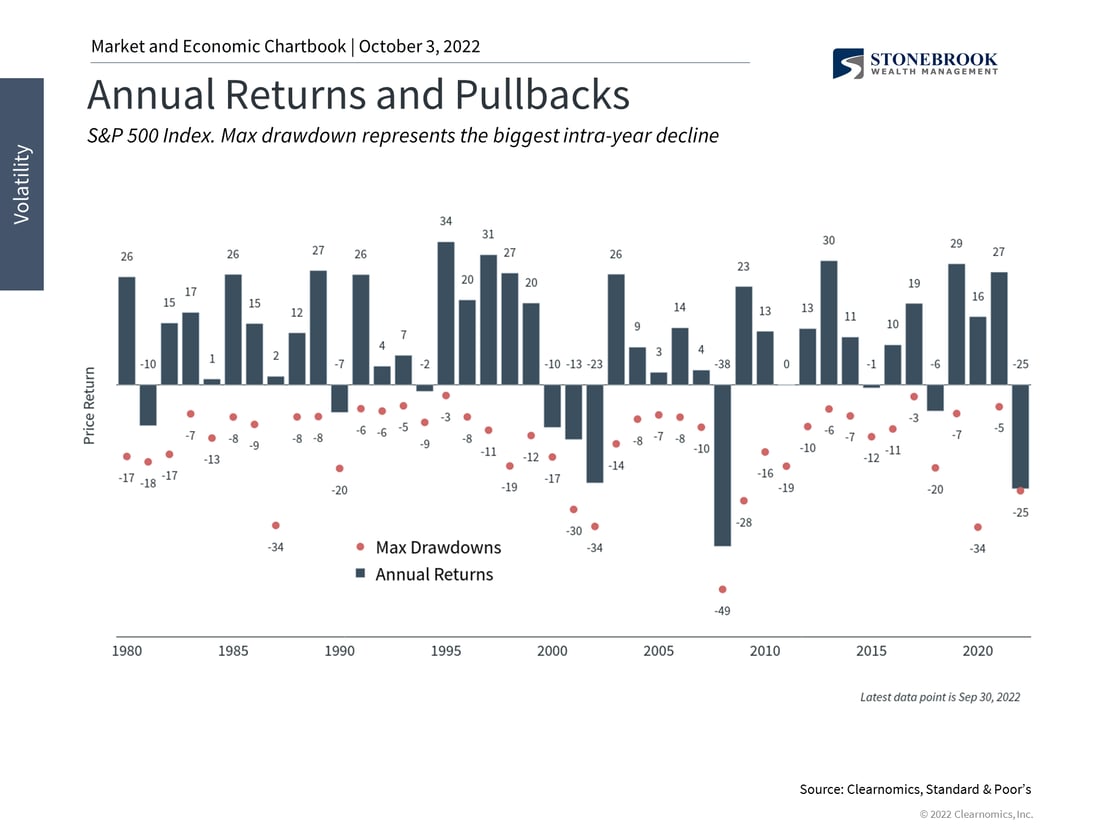 |
- This chart shows the performance of the stock market (bars) and the largest intra-year decline (dots) each year.
- The average year sees a stock market drop of -13.5%. However, most years still end in positive territory, averaging 9% gains.
- Volatility is a normal part of investing and investors are often rewarded for staying disciplined through short-term volatility.
For illustrative purposes only. Returns are based on price index only and do not include dividends. Intra-year declines refers to the largest market decline from a peak to a trough during the year. Returns shown are calendar year returns from 1980 to 2021.
Disclosure
The opinions voiced in this material are for general information only and are not intended to provide specific advice or recommendations for any individual. All performance referenced is historical and is no guarantee of future results. All indices are unmanaged and may not be invested into directly.